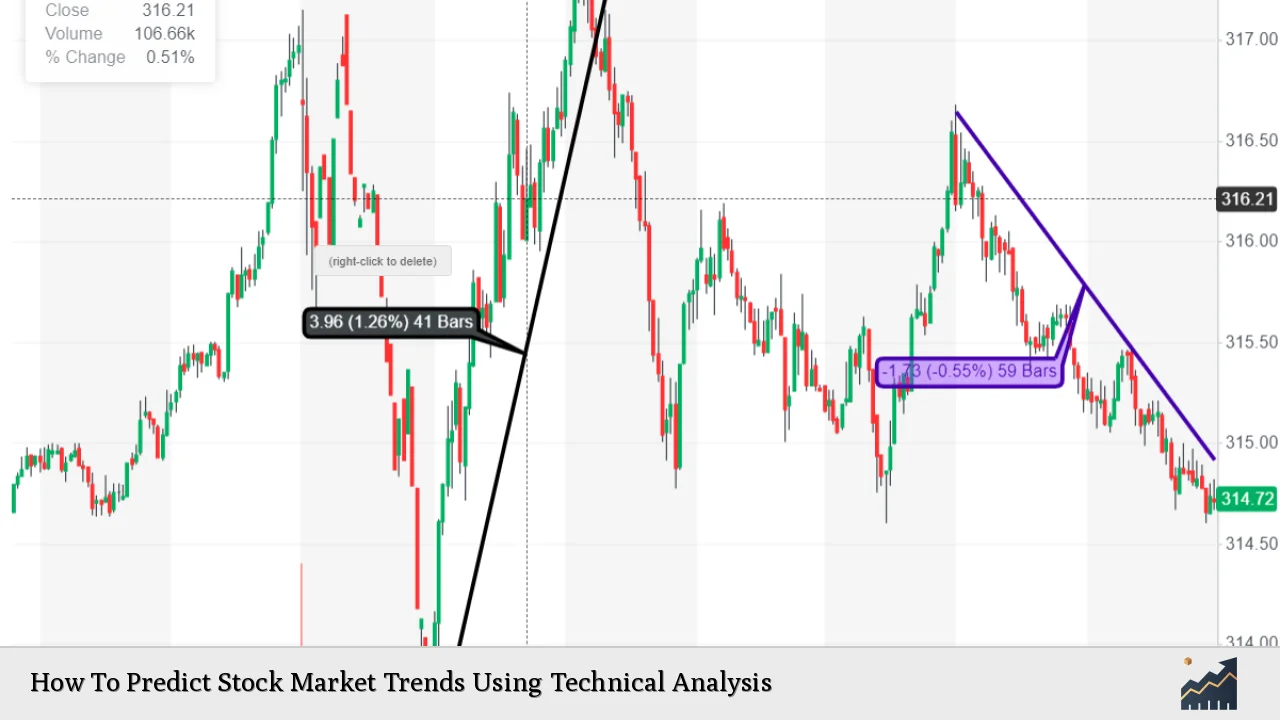
Technical analysis is a powerful method used by investors to forecast stock market trends based on historical price movements and trading volumes. By analyzing price charts and employing various indicators, traders can identify patterns that may suggest future market behavior. This approach is particularly useful in a volatile market where understanding trends can significantly impact investment decisions.
| Key Concept | Description/Impact |
|---|---|
| Price Patterns | Recognizing formations such as head and shoulders or triangles can indicate potential reversals or continuations of trends. |
| Support and Resistance Levels | These levels indicate where prices tend to stop and reverse, helping traders make informed decisions about entry and exit points. |
| Technical Indicators | Tools like Moving Averages, RSI, and MACD help quantify market momentum and identify overbought or oversold conditions. |
| Volume Analysis | Volume trends can confirm the strength of a price movement; increasing volume during a price rise suggests strong buying interest. |
| Market Sentiment Indicators | Sentiment indicators gauge the mood of the market, which can provide insights into potential reversals when sentiment diverges from price trends. |
Market Analysis and Trends
Understanding current market dynamics is crucial for effective technical analysis. As of December 2024, the stock market has shown remarkable resilience, with indices like the S&P 500 reaching all-time highs. The S&P 500 closed at 6,084.19, reflecting a 0.82% increase, while the Nasdaq surpassed 20,000 for the first time, closing at 20,034.89.
Current Market Statistics
- S&P 500: Closed at 6,084.19 (up 0.82%)
- Nasdaq: Closed at 20,034.89 (up 1.77%)
- Consumer Price Index (CPI): Expected to increase by 0.3% from October.
Key Trends
- Sector Performance: Cyclical sectors such as consumer discretionary and financials have outperformed due to strong economic indicators like retail sales and employment data.
- Interest Rates: The Federal Reserve’s gradual approach to interest rate cuts has provided a favorable environment for equity growth.
Implementation Strategies
To effectively utilize technical analysis in predicting stock market trends, investors should consider the following strategies:
Multi-Time Frame Analysis
Using multiple time frames allows traders to gain a comprehensive view of market trends. For example:
- Long-Term Charts: Identify overarching trends (weekly/monthly).
- Medium-Term Charts: Spot intermediate trends (daily/4-hour).
- Short-Term Charts: Determine precise entry/exit points (15-minute/1-hour).
Technical Indicators
Incorporating a variety of technical indicators enhances prediction accuracy:
- Moving Averages (MA): Smooth out price data to identify trends.
- Relative Strength Index (RSI): Measures momentum and identifies overbought or oversold conditions.
- Moving Average Convergence Divergence (MACD): Indicates trend direction and momentum strength.
Backtesting Strategies
Testing strategies against historical data helps validate their effectiveness. Traders can backtest their methods using software tools to simulate trades based on past performance.
Risk Considerations
Investing based on technical analysis carries inherent risks:
- False Signals: Technical indicators may generate misleading signals during volatile market conditions.
- Market Manipulation: Awareness of potential manipulation is crucial as retail traders often follow popular strategies blindly.
Risk Management Techniques
- Stop-Loss Orders: Implementing stop-loss orders can protect against significant losses by automatically selling when a stock reaches a predetermined price.
- Position Sizing: Adjusting the size of trades according to risk tolerance helps mitigate potential losses.
Regulatory Aspects
Understanding regulatory frameworks is essential for compliance in trading practices:
- Securities and Exchange Commission (SEC): Investors should be aware of SEC regulations regarding insider trading and market manipulation.
- Reporting Requirements: Traders must adhere to reporting requirements when engaging in high-frequency trading or using algorithmic strategies.
Future Outlook
The future of technical analysis in stock market prediction appears promising with advancements in technology:
Integration with Machine Learning
Recent studies indicate that machine learning algorithms can enhance predictive accuracy by analyzing vast datasets beyond traditional technical analysis methods. For instance, Long Short Term Memory (LSTM) models have demonstrated high accuracy in predicting stock price movements.
Increased Use of Artificial Intelligence
AI tools are increasingly being utilized for real-time data analysis, allowing traders to respond swiftly to market changes. This integration provides an edge in identifying emerging trends before they become apparent through conventional analysis.
Frequently Asked Questions About How To Predict Stock Market Trends Using Technical Analysis
- What is technical analysis?
Technical analysis involves studying historical price movements and trading volumes to forecast future market behavior. - How do I choose which technical indicators to use?
Select indicators that complement each other; for example, use RSI alongside moving averages for better trend confirmation. - Can technical analysis predict long-term trends?
While primarily used for short-term predictions, combining it with fundamental analysis can provide insights into long-term trends. - What are the limitations of technical analysis?
It may generate false signals and does not consider external factors such as economic news or geopolitical events. - Is it necessary to understand fundamental analysis?
While not mandatory, understanding fundamentals can enhance decision-making by providing context for price movements. - How often should I analyze my investments?
This depends on your trading strategy; day traders may analyze multiple times daily while long-term investors might review monthly or quarterly. - What role does market psychology play in technical analysis?
Market psychology influences trader behavior; understanding sentiment can help predict potential reversals or continuations in trends. - How do I manage risk when using technical analysis?
Implement stop-loss orders and diversify your portfolio to mitigate risks associated with trading decisions.
In conclusion, predicting stock market trends using technical analysis requires a multifaceted approach that combines various tools, strategies, and an understanding of current market dynamics. By staying informed about economic indicators and leveraging advanced technologies like machine learning, investors can enhance their predictive capabilities while managing risks effectively.

