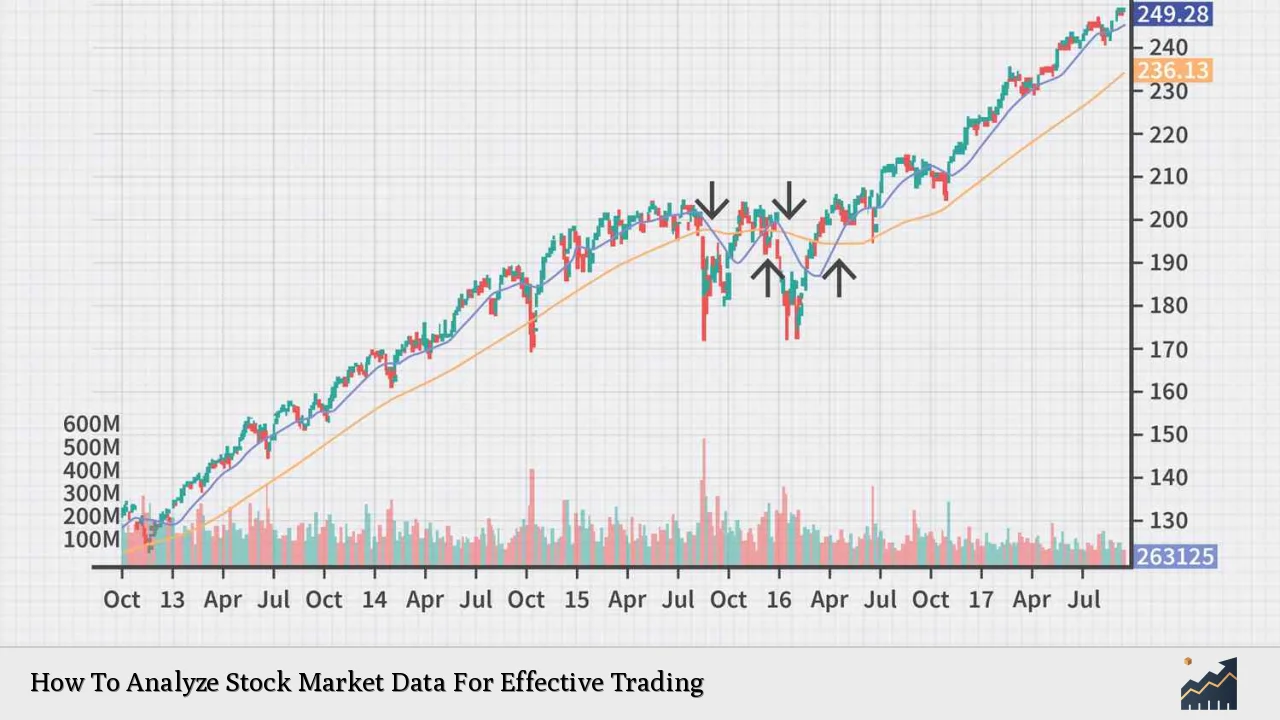
Analyzing stock market data is crucial for investors seeking to make informed trading decisions. This process involves understanding various market indicators, trends, and financial metrics that can influence stock prices. By employing robust analytical methods and tools, traders can enhance their ability to predict market movements and optimize their investment strategies. This article delves into the essential components of stock market analysis, providing a comprehensive guide for effective trading.
| Key Concept | Description/Impact |
|---|---|
| Technical Analysis | Utilizes historical price and volume data to identify patterns and forecast future price movements. |
| Fundamental Analysis | Examines a company’s financial health through its financial statements, assessing its intrinsic value. |
| Market Sentiment Analysis | Analyzes news articles, social media, and other sources to gauge investor sentiment and market psychology. |
| Data Visualization Techniques | Employs charts and graphs to interpret complex data sets, making trends easier to understand. |
| Risk Management Strategies | Involves techniques to minimize potential losses while maximizing returns on investments. |
| Regulatory Compliance | Ensures adherence to laws and regulations governing securities trading to avoid legal repercussions. |
Market Analysis and Trends
Understanding current market trends is vital for effective trading. Recent statistics indicate that the S&P 500 has risen nearly 30% year-to-date, reflecting a strong bullish sentiment in the market. Key trends include:
- Upward Trends: Characterized by rising prices, indicating favorable conditions for investment.
- Downward Trends: Marked by falling prices, suggesting caution for investors.
- Horizontal Trends: Indicate stagnation in price movement, which may require careful strategy adjustments.
Current Market Statistics
As of December 2024, the Nasdaq has recently closed above 20,000 for the first time, driven by strong performances from major tech companies like Alphabet. The S&P 500 also reached a closing high of 6,084.19. These movements reflect a broader trend of increasing valuations across various sectors, particularly technology.
Implementation Strategies
Effective trading strategies can be categorized into several approaches:
- Technical Trading: Involves using chart patterns and technical indicators such as Moving Averages (MA), Relative Strength Index (RSI), and Bollinger Bands to guide trading decisions.
- Fundamental Trading: Focuses on analyzing a company’s financial health through metrics like earnings per share (EPS), revenue growth, and debt-to-equity ratios.
- Quantitative Trading: Employs statistical models to identify profitable trading opportunities based on historical data.
- Sentiment Trading: Takes into account market psychology by analyzing news sentiment and social media trends.
Common Indicators Used
- Moving Averages (MA)
- Moving Average Convergence Divergence (MACD)
- Relative Strength Index (RSI)
- Bollinger Bands
- Stochastic Oscillator
Risk Considerations
Investing in the stock market carries inherent risks. It is essential to implement risk management strategies such as:
- Diversification: Spreading investments across various assets to reduce exposure to any single investment.
- Stop-Loss Orders: Setting predetermined sell points to limit potential losses.
- Position Sizing: Determining the appropriate amount of capital to allocate to each trade based on risk tolerance.
Emotional Factors in Trading
Emotions like fear and greed can significantly impact trading decisions. Traders should strive to maintain discipline and adhere strictly to their trading plans.
Regulatory Aspects
Compliance with regulatory bodies such as the Securities and Exchange Commission (SEC) is crucial for maintaining integrity in trading practices. Understanding regulations surrounding insider trading, reporting requirements, and market manipulation can help traders avoid legal issues.
Importance of Regulatory Compliance
Adhering to regulations not only protects investors but also fosters trust in the financial markets. Engaging with a SEBI-registered advisor can provide insights into navigating these regulations effectively.
Future Outlook
Looking ahead into 2025, analysts predict continued volatility influenced by macroeconomic factors such as inflation rates and Federal Reserve policies. The correlation between stock performance and interest rates will be a critical area for investors to monitor. The anticipated cuts in interest rates may provide further momentum for stock prices if economic conditions remain favorable.
Economic Indicators to Watch
- Consumer Price Index (CPI)
- Producer Price Index (PPI)
- Gross Domestic Product (GDP) growth rates
- Employment statistics
Frequently Asked Questions About How To Analyze Stock Market Data For Effective Trading
- What is technical analysis?
Technical analysis involves studying past price movements and volume data to forecast future price trends. - How do I perform fundamental analysis?
Fundamental analysis requires examining a company’s financial statements, industry position, and economic factors affecting its performance. - What are the best indicators for day trading?
The best indicators include moving averages, MACD, RSI, and volume analysis tools. - How can I manage risk in stock trading?
Risk management can be achieved through diversification, stop-loss orders, and proper position sizing. - What role does market sentiment play in trading?
Market sentiment reflects the overall attitude of investors towards a particular security or financial market, influencing price movements. - Why is regulatory compliance important?
Regulatory compliance ensures that traders operate within legal frameworks, thus protecting them from penalties and fostering market integrity. - What are some common mistakes new traders make?
Common mistakes include emotional trading, inadequate research, ignoring risk management principles, and overtrading. - How often should I review my trading strategy?
A regular review of your trading strategy is recommended—at least quarterly—to adapt to changing market conditions.
In conclusion, analyzing stock market data effectively requires a comprehensive understanding of both technical and fundamental aspects of investing. By leveraging analytical tools, adhering to regulatory standards, managing risks prudently, and staying informed about market trends, investors can enhance their decision-making processes. This multifaceted approach not only aids in navigating the complexities of the stock market but also positions traders for long-term success.

